Now you have an amazing mobile app. What now?
You want your audience to enjoy it as much or more than you do. This will help you generate revenue. How do you measure success and track your progress toward your ultimate goals?
To measure app performance, you can track your most critical mobile app KPIs and metrics.
This article is a great resource. We will discuss 51 mobile app KPIs.
General Mobile App KPIs
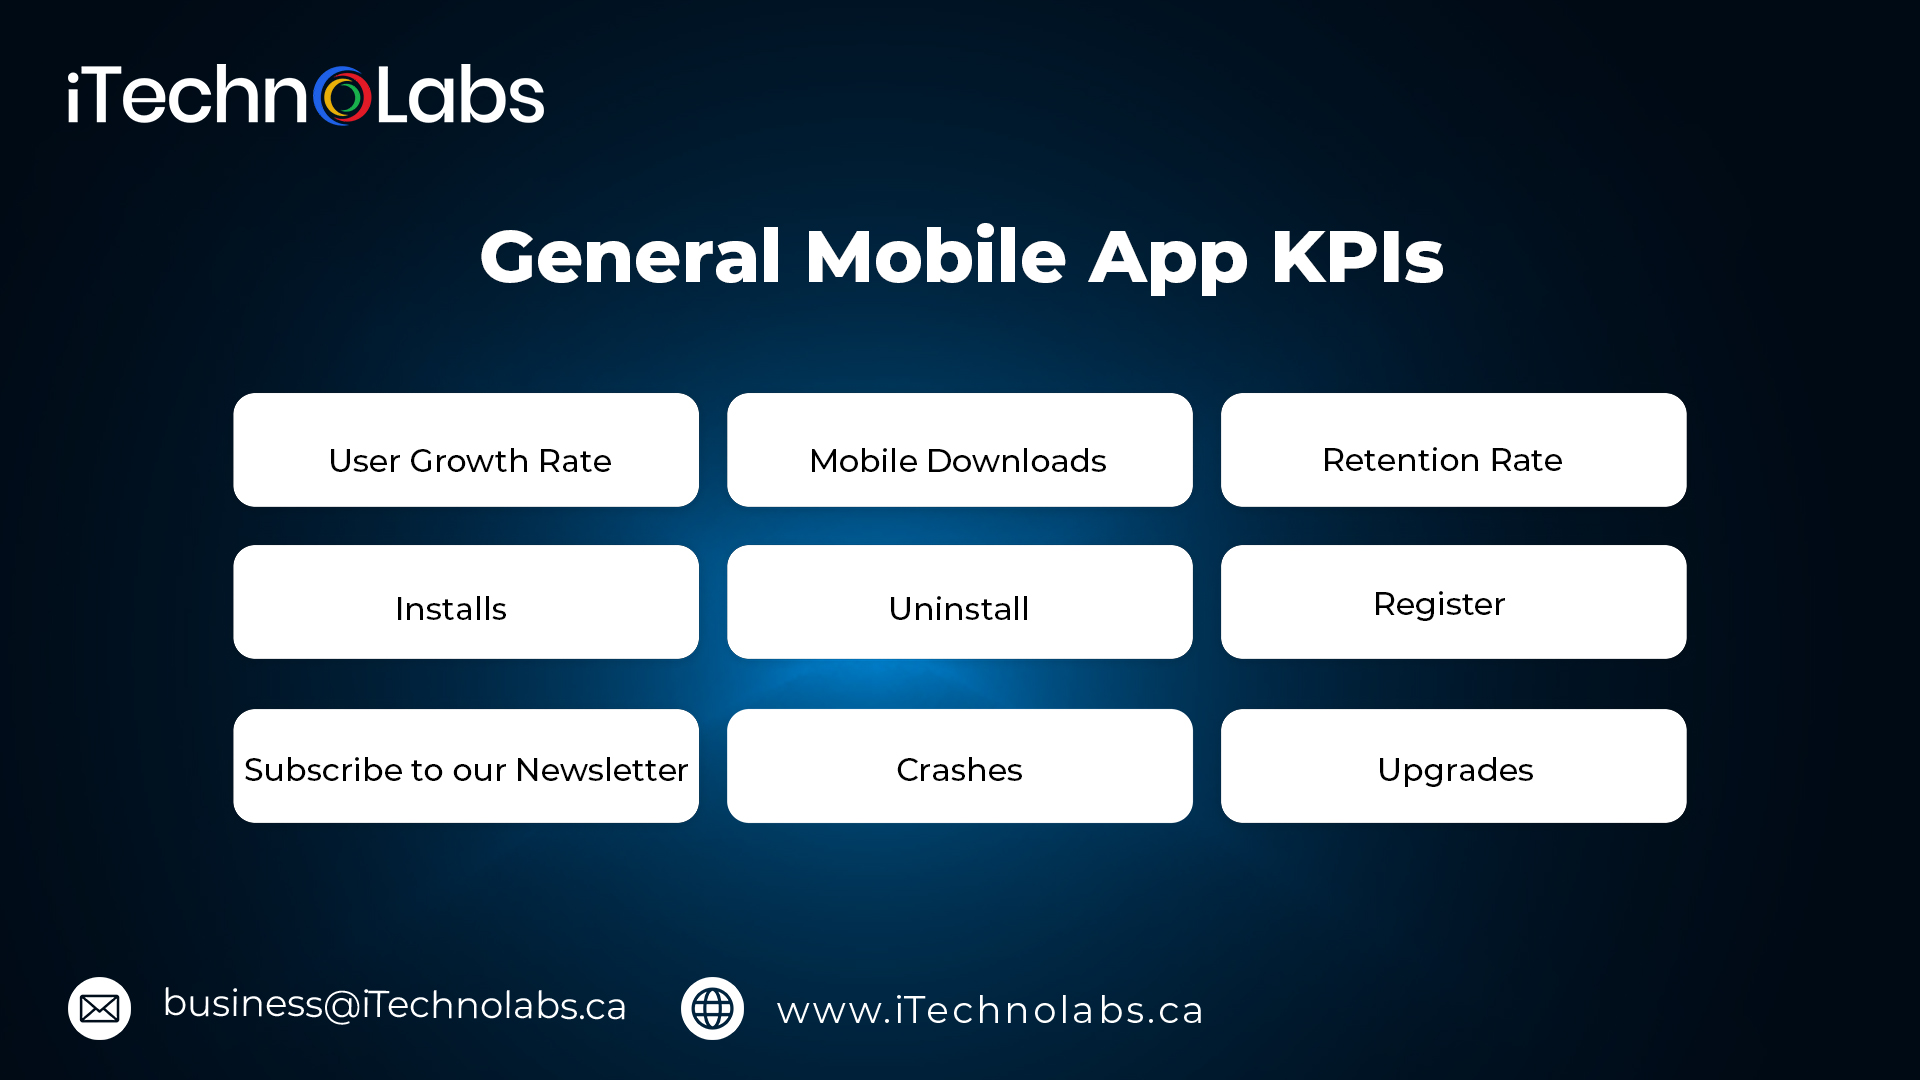
Some KPIs can be used to measure the performance of mobile apps. These should be tracked by nearly everyone involved in app development and marketing. The app determines how much weight and consideration each person carries.
Many of the KPIs described in this article can easily be tracked using mobile analytics tools.
-
User Growth Rate
This will allow you to monitor your user base to see if it is growing and what.
Is it a result of certain events, such as price changes, app updates, or other activities? Is it steady and slow?
Here’s how to increase your user growth rate.
((Present User Amount – Past User Amount) / (Past User Amount)) X 100
-
Mobile Downloads
Perhaps the easiest and most obvious way of tracking its popularity among users is to count how many times an app has been downloaded to a device. You should monitor app downloads as this KPI is the base on which most KPIs are built.
-
Retention Rate
A user’s ability to return or come back after some time. If people continue to use the app consistently, retention is a sign that it has become a valuable or “sticky” app.
Higher retention rates have greater potential for future earnings.
Retention rate = ((CE-CN)/CS)) X100
CE = Number of customers at end of period CN= Number of new customers acquired in this period CS = Number of customers at the start of the period
How can you improve your retention rates? Analyzing your app data can help you identify any areas that are causing users to drop off or disengage. These issues can be addressed by making changes to the app, which will ultimately improve retention rates.
Platforms such as iTechnolabs can track retention and user behavior and allow you to make informed decisions regarding how to improve your app to increase retention rates. This will ultimately result in increased revenue and success for your app.
-
Installs
It doesn’t necessarily mean that the app was downloaded by someone. You should track actual installation on all devices used by your audience.
-
Uninstall
An individual can choose to uninstall her application for any number of reasons. However, they may not always leave feedback or provide a reason.
If the uninstalls are related to an update or other changes in your app, advertising methods, or targeting, you need to consider why.
-
Register
Another sign that your users are buying what it is selling, at the very least metaphorically, is their decision to register or not.
You can also use their email addresses and other contact information to market future updates or other apps to them. You should review your onboarding process if users fail to sign up after downloading your app. To get a complete picture of user behavior, combine funnels, screen flow, and heatmaps with session recordings.
-
Subscribe to our Newsletter
You should track the signups and unsubscribes if you offer subscriptions to new content or updates.
You can also track how long it takes for users to subscribe after they install the app. This information, along with the average length of subscriptions, will give you insight into your users’ behavior.
-
Crashes
An app can crash frequently after being downloaded and installed.
To improve performance and retention, it is important to keep track of how many crashes occur at what stage of the user process.
Mobile analytics solutions can help you identify the root cause of crashes. You will be able to see, for instance, which devices are responsible. iTechnolabs helps you to analyze and reduce crashes within your apps. This platform provides detailed crash reports and insight into the root causes of crashes. This information can be used to identify and fix any issues that could cause the app’s crash. It will also improve stability and reliability.
iTechnolabs provides many tools and features that can help developers improve their app’s user experience. These include heatmaps and user session recordings. They can also help developers identify areas that need improvement.
iTechnolabs can be used to analyze and track crashes and ensure that users have a smooth experience. This will increase retention and help your app succeed.
-
Upgrades
Track the number of and the timing of upgrade requests if you offer an option to upgrade to a premium or paid app. What is the average time it takes for a user to update an app after they have installed it or registered?
What percent of users upgrade to a paid or basic version?
Are the ratings for the upgraded version higher than those of the basic version? Or are they the same?
These data show how engaged your users are with the app, and what level of financial commitment they may be willing to make. These are vital data for calculating the value of your mobile app.
App Engagement Metrics- Mobile App KPIs
Other performance indicators are used to measure user engagement with the app. These include how, when, and where they use it, as well as how they connect with or interact with your app.
1. Sessions
The number of sessions that you create, also known as how many times users open up an app, is a measure of popularity and “stickiness”. This is because the more sessions that a user creates and the more app gets, the better.
Remember that digital analytics refers to a session as a specific user or device-specific set of interactions that occur on your app or website within a certain timeframe. It is therefore important to define what a session is for your specific app or project.
Additionally, you can calculate “stickiness” by multiplying your daily users (DAU) by your monthly users (MAU).
DAU/MAU = Stickiness
2. Session Length
How long do users spend using the app each session? The time that a user spends using the app is generally the best. However, you might also consider session duration to see if there’s a correlation.
Depending on the app’s functionality, goals, and other factors, users may not be required to stay for long periods to convert or take desired actions. You might track the session duration, AOR, or several sessions more effectively in this case.
3. Session Interval
How often do users visit each session, e.g. Do you visit more than one time per day?
Less frequent intervals are better. This KPI can be tied to updates to your app or other important events.
If you have new content every morning, your session intervals will likely be 24 hours. However, if your app doesn’t tie to any particular time or event, it might be preferable to have shorter intervals.
4. Session depth
The number of interactions per session. This is how far someone travels on the user journey before they close a session or an app.
Going from browsing to buying or leveling up in a video game might signify more session depth. Logging and checking for new content, or using an app that only requires a brief time to use its functionality (e.g., a calculator or photo editor) may be less important.
5. Average Screens Per Visit
The average number of URLs or pages a user visits during each visit.
The higher the number, the more profitable your app will be, especially if you rely upon advertising to monetize — more screens equals more impressions or views.
6. Daily Active Users (DAU).
The daily active users of the app.
It is common to calculate the value or future growth of a project by combining the DAUs for a month or a year.
7. Monthly Active Users (MAU).
A monthly number of active users. These are counted as unique visitors who visit the app for multiple sessions. It is important to monitor both app usage metrics.
8. Social shares
This is the number of times your app has been shared or recommended on social media. The greater the number, the better. However, it is important to verify when, where and in which context your app was shared.
This is particularly important if your app has any social media integration or functionality.
9. Brand Awareness
There are many ways to measure brand awareness. These include how often your brand appears in search engine results and on social media.
You want users to be aware of your brand. However, you should also analyze the variety of mentions of your brand.
10. Churn Rate
The rate at which active users unsubscribe from or uninstall your application.
A low churn rate is desirable. If the churn rate is high, it could indicate functionality issues elsewhere. This can be checked by looking at when and where the app crashes or when users log out or drop off.
Churn Rate could also be caused by a lack of changes, new content, or new levels or achievements — if your app’s gamified.
Revenue-Focused/Financial Mobile App KPIs
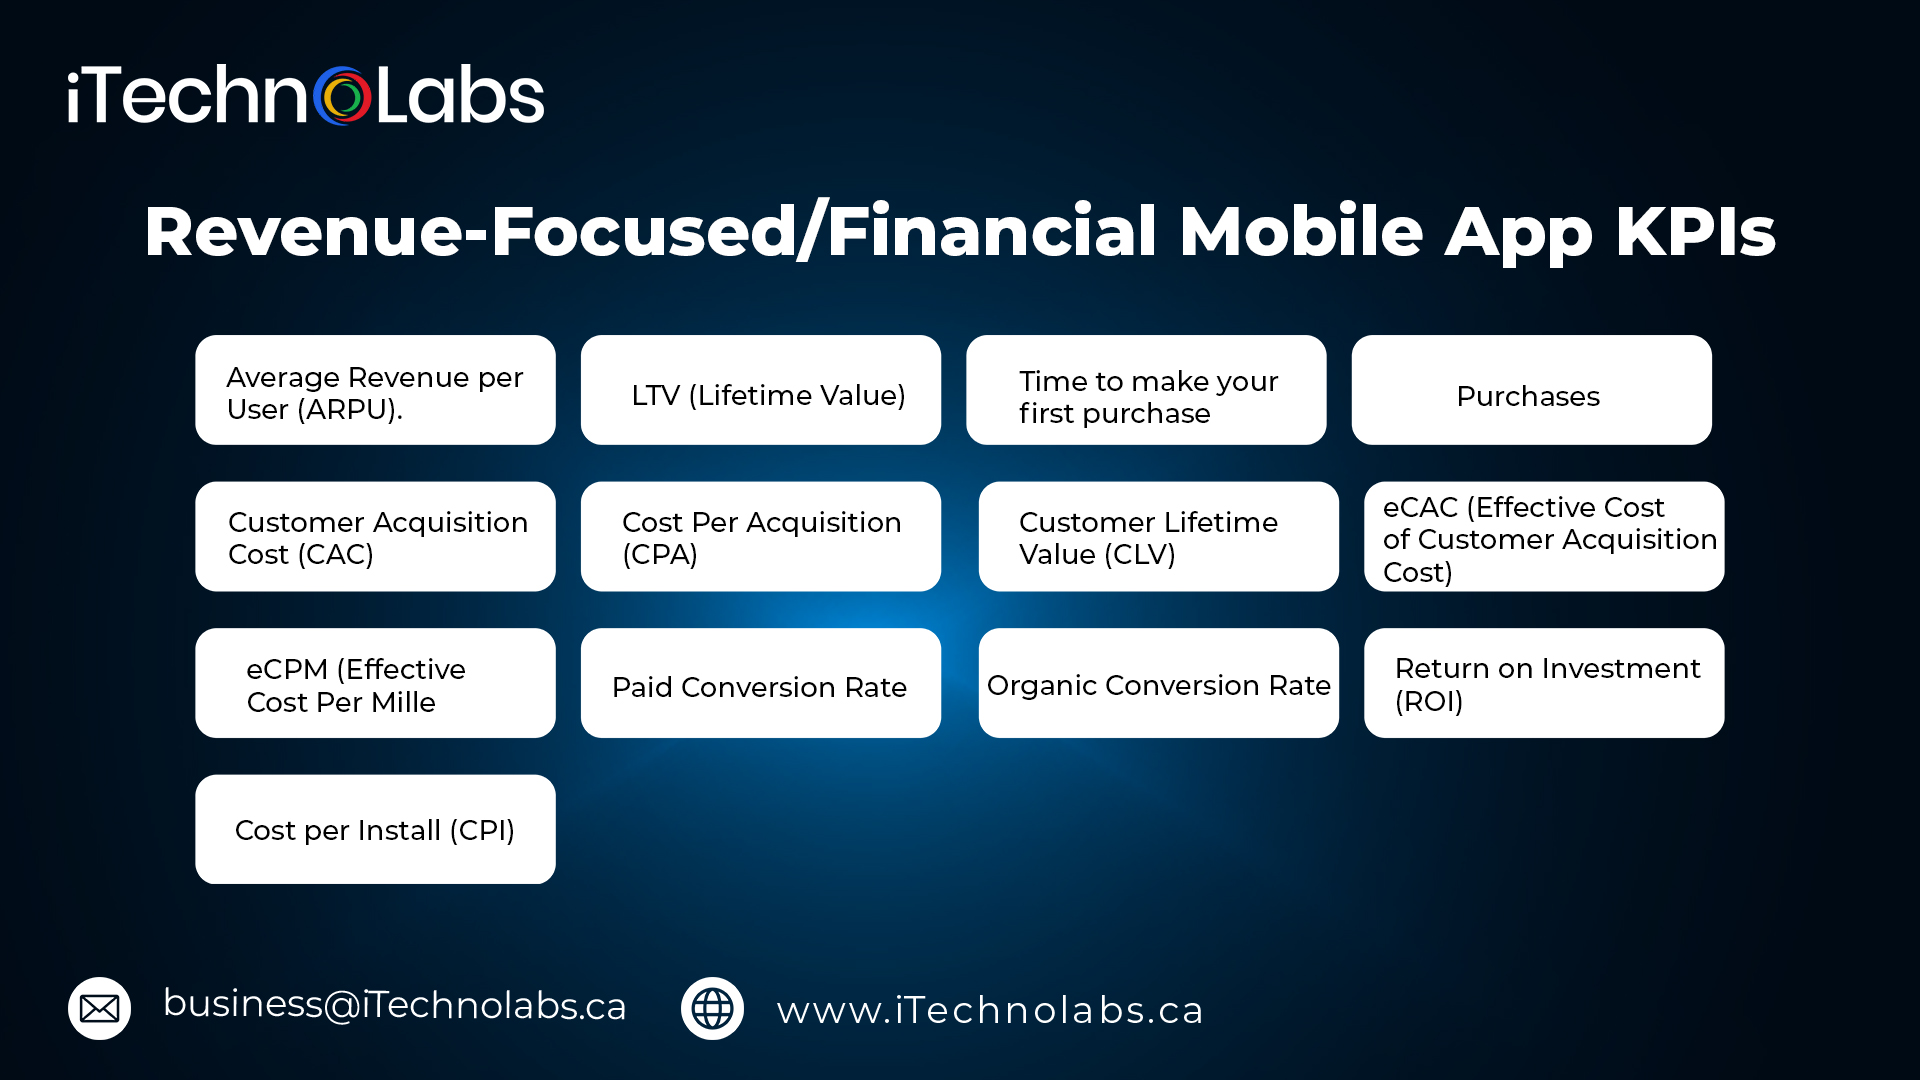
While money may not be all, it is important.
You want your app to be financially viable and profitable. You will need to determine how your app is generating revenue by using metrics such as the following KPIs.
-
Average Revenue per User (ARPU).
The average value of cash or value generated per user through in-app purchases.
This figure is multiplied by the number of active users or the size of the user base. It gives an idea of the app’s overall value.
Lifetime Revenue/# of Users
-
LTV (Lifetime Value)
The lifetime value of a user is the total revenue generated by your app so far. It can be combined with the average revenue per customer to help determine the app’s potential revenue or value.
Conversion average value X Conversions per hour X Customer Lifetime
-
Time to make your first purchase
The mobile app KPI measures the time it takes for a user to make a purchase. This could be an in-app or e-commerce transaction, or a premium or upgraded version.
Date/Time at which the First Purchase was Made – Date/Time Recorded (in days).
-
Purchases
This number is easy to remember and it’s important to keep track of any type of money exchanged within your app, including in-app purchases, premium versions, subscriptions, or e-commerce.
-
Customer Acquisition Cost (CAC).
Cost of acquiring a customer, e.g. the advertising costs for your app. Time is money.
This number can be determined by multiplying the gross revenue for a period by the marketing and sales costs incurred in the same period.
Cost to Acquire a New Customer/# of New Customers
-
Cost Per Acquisition (CPA).
Cost per conversion
The mobile app KPI does not necessarily indicate that a customer converted to the app, but rather, that they have a new behavior such as signing up for a subscription or upgrading to a premium level or higher, making in-app purchases, or giving permissions.
Price / # of Acquisitions
-
Customer Lifetime Value (CLV),
The net profit a customer generates throughout their lifetime is what determines the lifetime value. It depends on how much they spend on the app and how much they pay for the acquisition.
A mobile app’s user pool that has a high average CLV can be a huge asset. Remember that app with high CLV to CAC ratios are more likely to be successful.
Customer’s annual profit contribution X Average length of time they are a customer, minus initial costs of customer acquisition
-
eCAC (Effective Cost of Customer Acquisition Cost)
Actual or effective cost to acquire new customers. This includes organic discovery methods and paid advertising.
It is calculated by adding the number of new clients to the impressions generated by marketing campaigns and adjusting for the cost of those campaigns.
-
eCPM (Effective Cost Per Mille)
The cost per 1,000 impressions, or actions, including organic marketing and paid marketing efforts.
This is calculated by dividing the number of views generated through marketing efforts by the number of customers gained.
Advertising Cost X (Impressions / 1,000)
-
Paid Conversion Rate
Paid advertising conversion rate
This includes display ads, PPC advertising, PPC advertising, social media ads (e.g. promoted Tweets or Facebook posts boosted), sponsored posts and reviews, or any other method for marketing your mobile app that involves an exchange of money for mentions, views, or both.
-
Organic Conversion Rate
Unpaid discovery is the rate at which your app converts. This includes organic search, word-of-mouth mentions on Social Media, influencer marketing, and buzz.
-
Return on Investment (ROI).
Any marketing tactic or technique’s return on investment is calculated by subtracting the number of customers or revenue gained from marketing by how much marketing was spent, including any expenses.
(Gain From Investment – Cost of Investment)/ Cost of Investment
-
Cost per Install (CPI).
The cost per install is the customer acquisition cost of customers who installed your app following an advertisement. It tracks both paid and organic installs.
Ad spend / # Installs directly tied to Ad Campaign
Important Article: Why Does Every Business Need a Mobile App in Today’s Time?
Mobile App KPIs for User Experience
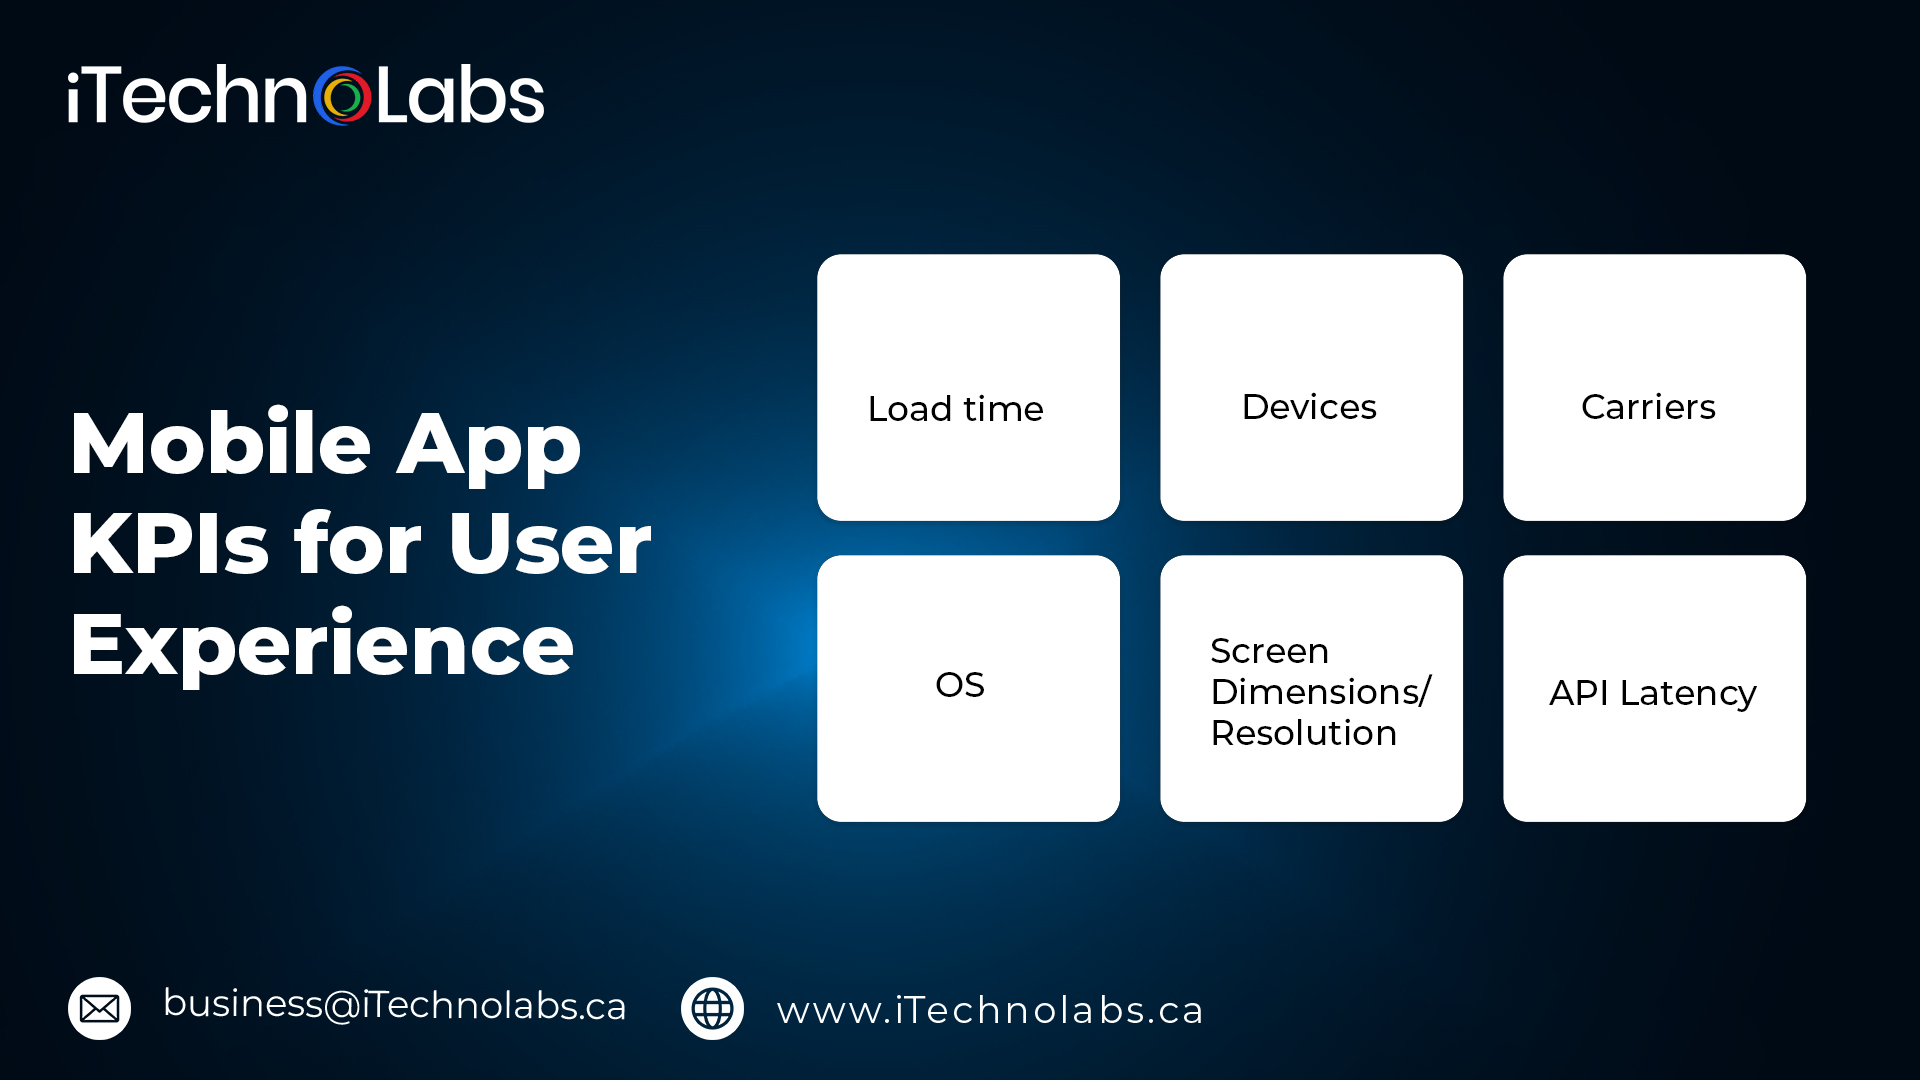
The most important factor in determining whether a mobile application succeeds or fails is the user experience.
As a marketer or developer of mobile apps, this is the best activity you can do.
1. Load time
It is the time taken by an app to load, from the initial tap until it is ready to be used. This also applies to in-app screens, and the time it takes for the user to switch between one screen or activity.
A faster load time means that the app loads quickly and provides a better user experience. Your load times should be as low and as short as possible.
2. Devices
Another KPI you can track and define is the number of devices your users use to access your app.
It is important to determine the preferences of your target clients. This will help you decide if they prefer tablets or smartphones. This will allow you to target your app’s performance.
3. Carriers
Your app’s device is only one part of the equation. If you’re targeting a specific geographic area, it is important to know the preferred carriers of your users.
4. OS
For both developers and users, this is most likely a question about Android versus iOS. However, your app should be able to work on both.
You should consider whether there is a high uninstall or crash rate for either OS or if you have a preference between Apple and Android. Find out the root cause of these problems and fix them.
5. Screen Dimensions/Resolution
This KPI is usually related to the devices your customers use to access your application. This is an important factor to take into account when updating or creating future versions. It can be correlated with performance metrics such as crashes or uninstalls in mobile apps.
6. API Latency
This is the time between API proxies being called/triggered and their response/load time. This number should be very low in general. This KPI is tied to the app’s load time and user behavior.
Mobile App Marketing KPIs
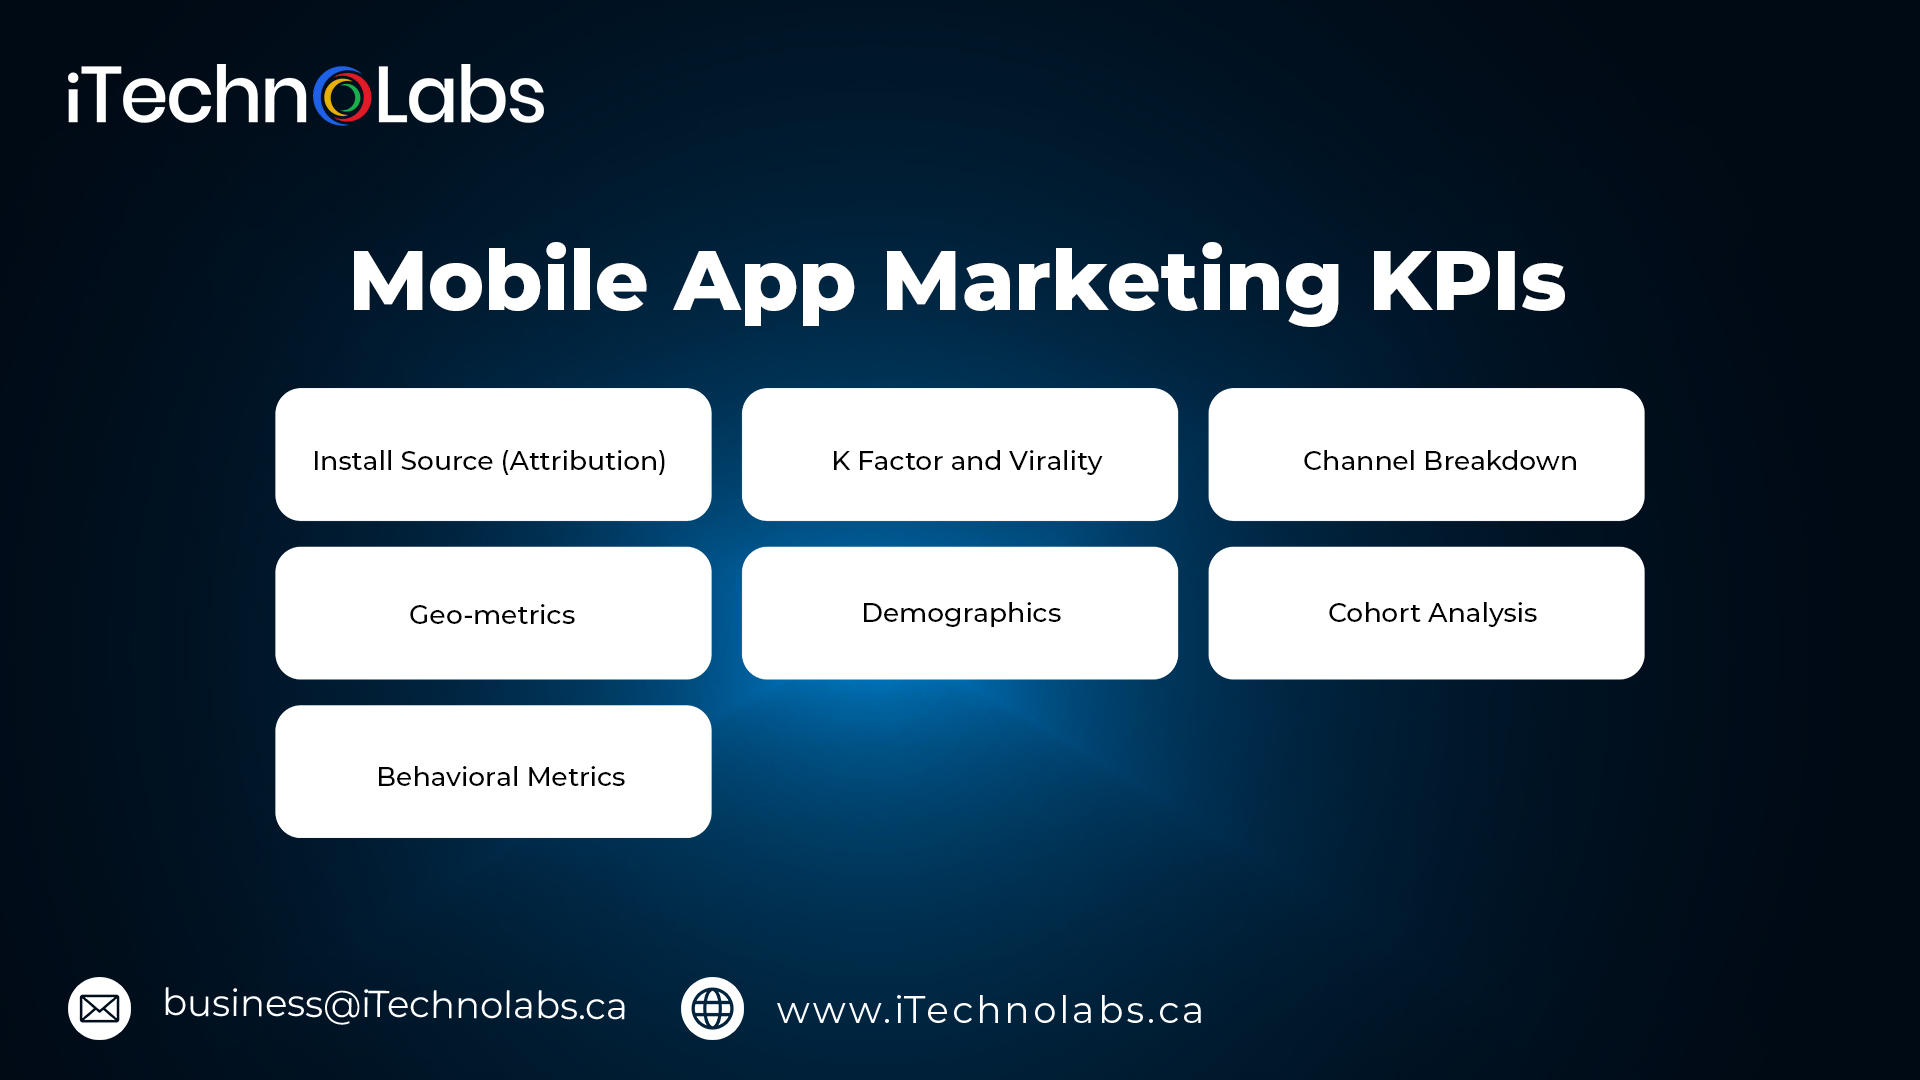
You can use a variety of performance indicators to measure the effectiveness of your marketing efforts.
It is important to choose the best mobile marketing KPIs, which track your most effective or preferred methods. You also need to measure your app growth and mentions via social media and influencer networks.
You should monitor your app store analytics and report on paid advertising to determine what drives downloads.
-
Install Source (Attribution)
Your campaign will be shaped by the platform and referral source that your customers use to discover and install your app.
- What is the ratio of organic mentions to paid ads?
- Which sources are most successful and which are not?
- What app store do they use? How do they get to your page (keyword search or inbound link, social promotion, etc.)?
This can be done by tracking more successful sources, and lowering or adjusting your marketing methods to less beneficial ones.
-
K Factor and Virality
This is the viral popularity, or word-of-mouth surrounding your mobile app marketing. There are many ways to measure virality, but one common way is to multiply the number of mentions (organic and paid) by the conversion percentage.
To track virality effectively, choose one method to follow from the beginning, and stay with it until the end.
-
Channel Breakdown
You should consider the types and range of channels users use to access your app. You should aim to have a wide range of sources. Also, analyze the source to determine its popularity among your target demographics. Finally, analyze how users behave after downloading and installing your app.
-
Geo-metrics
In-app purchases, as well as ad revenue, can be affected by the geographic location of your users.
The mobile app metric will also help you plan your future mobile marketing campaigns. It will tell you which areas to target and which ones are already saturated.
-
Demographics
Your audience’s gender, ethnicity, age, etc.
It is a great way to gauge the effectiveness of your marketing efforts by comparing your customer base to your target audience.
-
Cohort Analysis
You can group your user base into multiple categories or collectives based on demographics, location, in-app behavior, or other common characteristics.
You can learn valuable lessons from your customers by grouping them and observing their patterns.
-
Behavioral Metrics
Your app’s unique behaviors can provide valuable insights into your audience’s mind.
This KPI for mobile apps measures how users arrive at your app, and what they do after they have downloaded it. This can include any other apps that they have downloaded and their participation in social networks or websites that they visit regularly.
Tracking behavioral metrics is essentially a way to build a user profile and create marketing plans and app features that tap into these users.
KPIs for App Store Optimization (ASO)
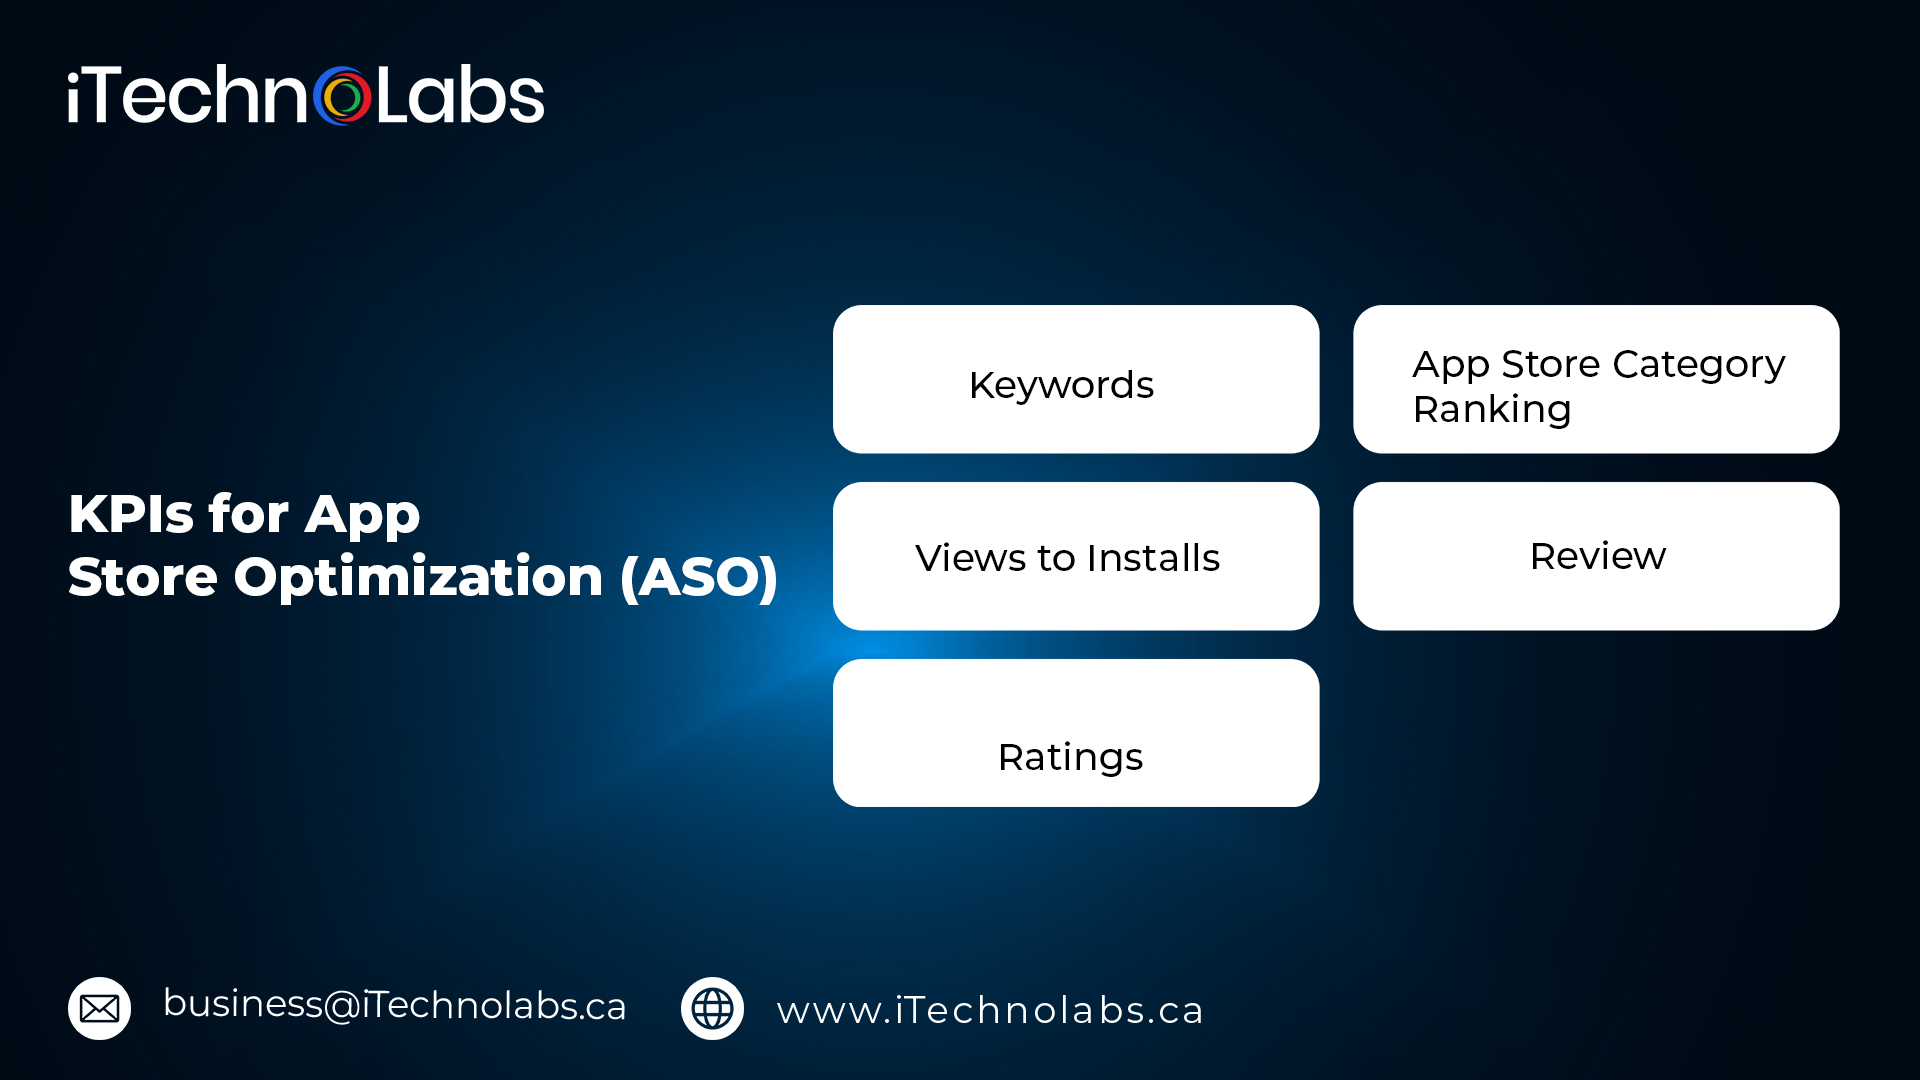
The app store experience is perhaps the most important aspect of marketing and promoting your app. It’s how users discover it and decide whether they want to download or buy it. They also rate and review it.
1. Keywords
Keywords and phrases that users use to find your app and download it.
You can track the user’s journey from initial keyword search to purchase and see which keywords generate revenue.
This ASO Tool allows you to track keyword rankings in Google Play or App Store.
2. App Store Category Ranking
It is important to monitor your rankings over time, and analyze how they impact your app’s performance. In general, the higher your ranking, the better your performance.
3. Views to Installs
This is the number of times that a user has viewed your app listing prior to installing it.
The better the number of installs you get, the more effective it is. This shows that your app store listing and advertising are effective.
4. Review
Positive reviews are better than negative ones. Be attentive to how many reviews you receive as this indicates that users are interested enough to leave a review about your app.
Negative reviews are a great way to learn from others what you can improve on. Positive reviews, however, can help you identify features you need to enhance, augment or upgrade to a premium or spin-off version.
This type of feedback can sometimes reveal the best information about people’s needs.
5. Ratings
App store reviews are rated positively and have a higher average rating.
Despite this, ratings are not indicative of passion and engagement like reviews.
However, not all metrics and KPIs for mobile apps are created equally when it comes to measuring the success of a mobile app or putting a value on that app.
Mobile app developers need to consider many key performance indicators at different points during the creation process. It is not easy to distill all of these apps into one coherent report or analysis that tells a story.
Important Article: Top 8 Mobile App Development Challenges You Might Face
Do You Want to measure your mobile app KPIs?

Conclusion
iTechnolabs is a leading web app development company that will help you measure your mobile app KPIs.